Debunking a cat's misleading Covid fertility graphs
DEEP DIVE: "Excess births" and vaccination data shows NO impact of Covid vaccines on fertility
In my last post on 2022 birth rates, I concluded that Covid vaccines did not cause infertility, which many skeptics of the medical establishment had once understandably feared.
Such fears were understandable, given evidence that the vaccine can impact menstrual cycles, and the politicization of the medical experts during Covid. But now the data is in — and the subject is still relevant, because mRNA vaccines will surely be used to fight other diseases in the future.
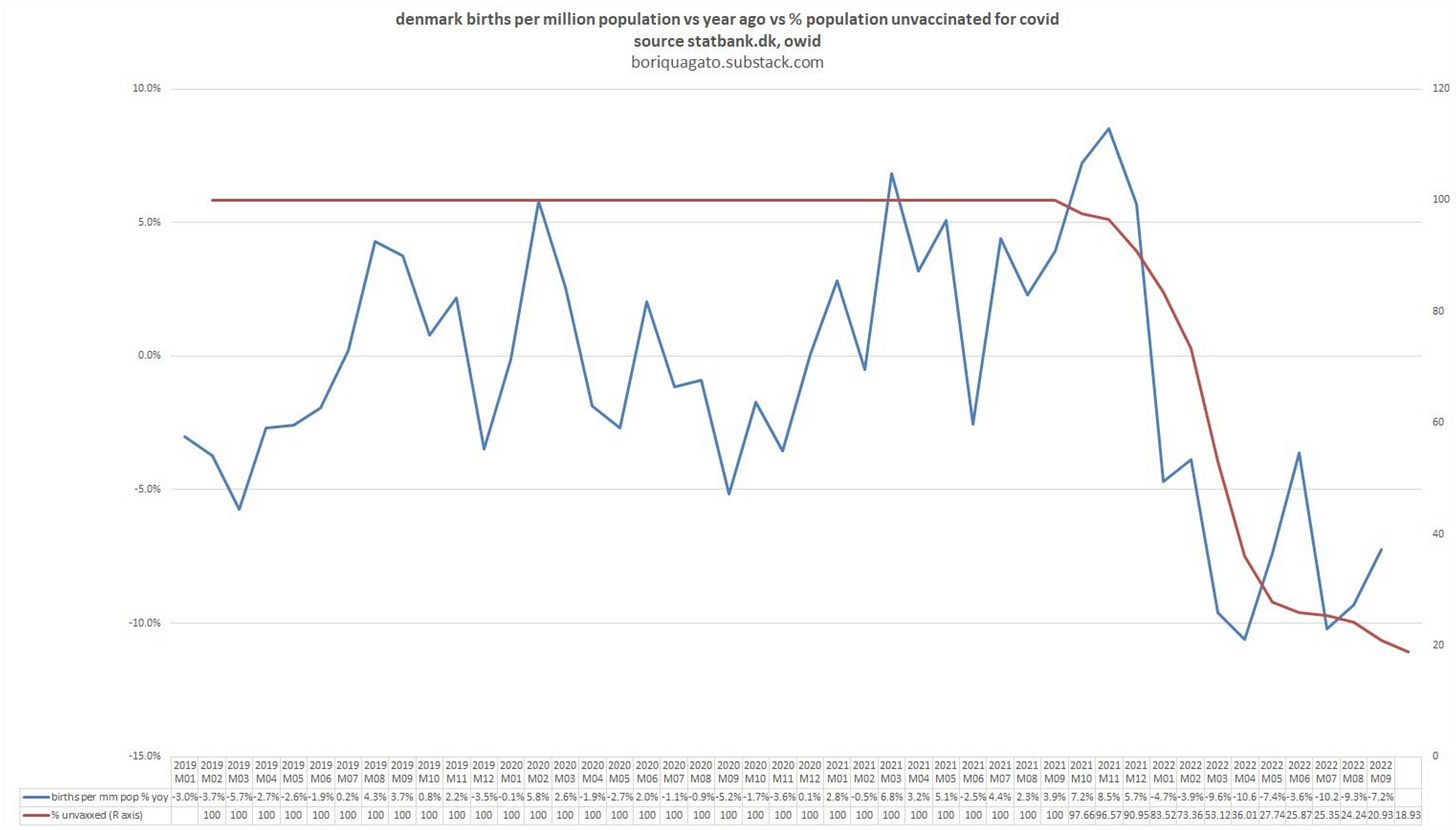
But after my last post, several commenters alerted me to an analysis on “Bad Cattitude”, a much bigger Substack. It has “thousands of paid subscribers”, according to Substack. The author looked at similar data, and reached the opposite conclusion from mine. For example, here’s the author’s chart for Denmark showing a plunge in births right when the vaccine was given (blue is change in births, and red is % of people unvaccinated):
Looks scary! It makes it seem like births plummeted as soon as the number of unvaccinated people fell.
I’ll get to a detailed analysis of that blog’s charts — but first, let’s look at the raw birth data:
Visualizing birth data
In my last post, I compiled and presented data from nine countries that reported births for 2022.
All countries saw slight declines in births after vaccination, but, eyeballing the graphs, the falls were roughly in line with falling trends in previous years. In this post, we’ll evaluate the data rigorously.
In my last post, I started with Spain. Here it is again, this time with monthly data from 2015 to 2022:
We see that the birth rate has been falling at a pretty constant rate for years.
We can also use the the years 2016 - 2021 to predict expected births in year 2022, using a simple linear regression for each month. That is how excess deaths are often calculated, and how they should be calculated when long-run trends are in play.
Doing that, we get this bright-yellow line for expected births in 2022:
The above graph shows that Spain’s actual birth rate in 2022 was actually slightly above what we’d expect from past trends.
Additionally, we can add vaccination timing to the graph:
We can see that by April 2022, more than 80% of Spaniards had been vaccinated for at least 9 months. Yet we see NO negative change in the birth trends.
Just this one country makes clear that there is no Covid vaccine fertility catastrophe.
There’s simply no connection in Spain between the timing of the spike in vaccinations, and births. Births stayed steady in both the months around administration, as well as 9 months later, when babies began to be born to fully vaccinated parents.
Overall, Spain had an “excess birth” rate in 2022 of 4.9% — that many more births were seen than would be expected from past trends.
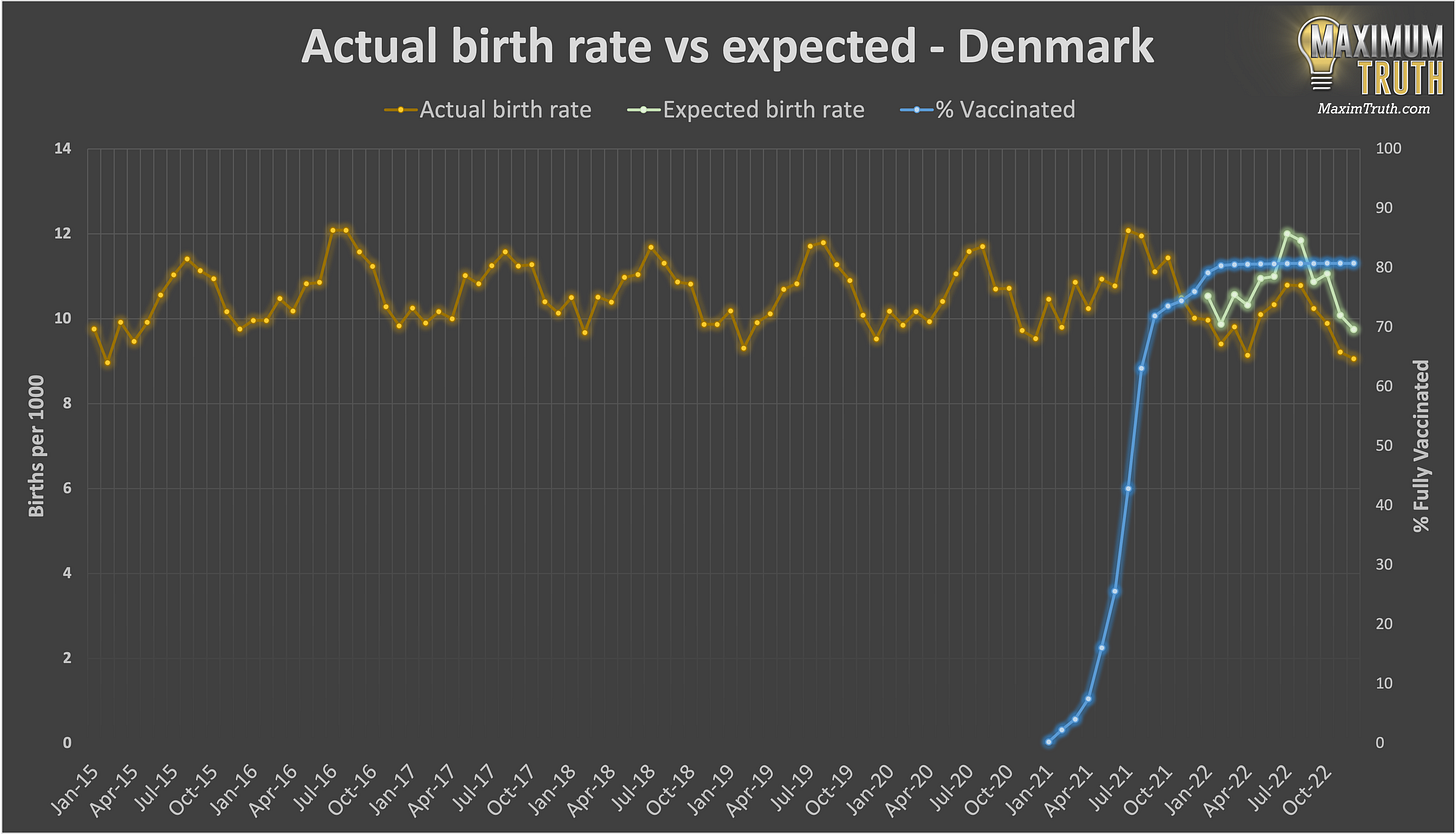
But Spain is just one country, and many countries show the opposite trend. For example, here’s Denmark:
It’s the flip side of Spain. 2022 ended a slightly rising trend, and there were 7.9% fewer births than we’d expect from the trend.
If we were looking just at Denmark, one might think it plausible that there was a small but real effect of the Covid vaccine on fertility.
But even Denmark disproves any apocalyptic “Children of Men” kind of scenario, which some had worried about.
We don’t need to rely on just Denmark or Spain. I now have been able to find 2022 data from 21 countries/regions1, and we can apply the same method to every one:
Births around the world fell 4.5% more in 2022 than previous trends would predict
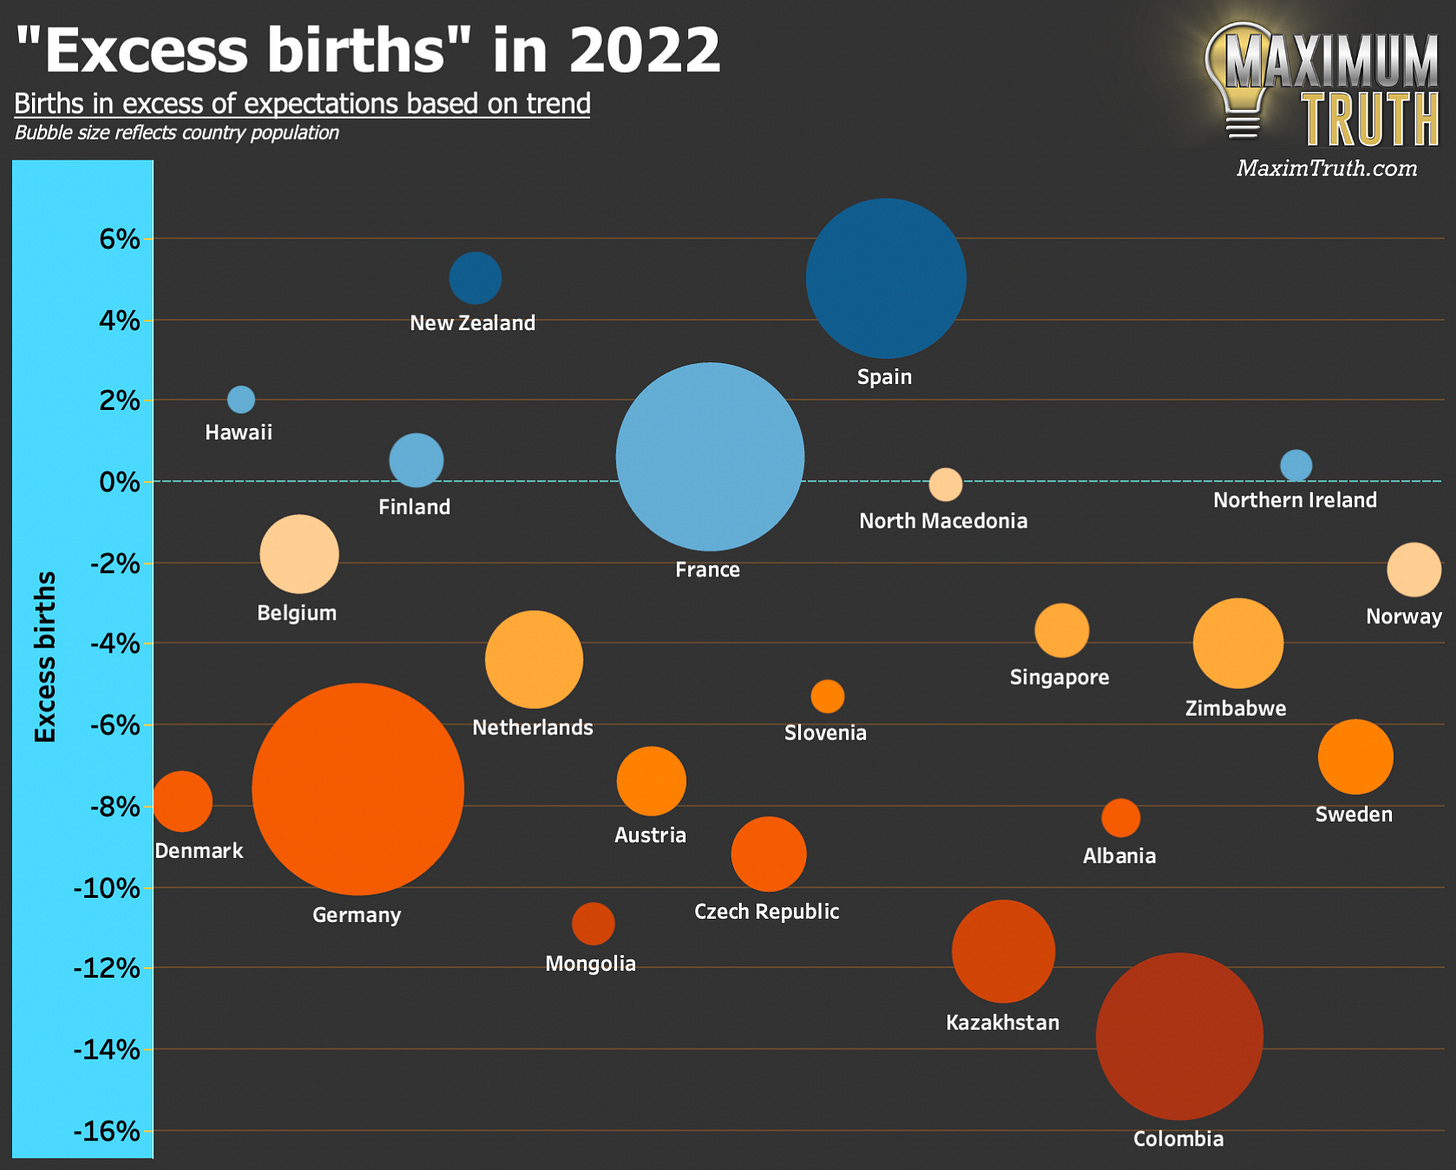
Here’s a chart showing “excess births” (or the reverse) for every country. The size of each circle reflects country population:
We can see that 6 places had unexpected gains in fertility, while 16 had unexpected drops in fertility.
Averaging this all together, countries/regions had 4.2% fewer births in 2022 than one would expect from their trends.
If one weights by population size, countries/regions had 4.5% fewer births in 2022 than one would expect.
One might be tempted to conclude: “so the vaccine had something like a modest -4.5% impact on fertility.” But there are many other factors in play, and one other critical thing to look at:
Countries with more vaccinations had MORE extra births
In the above graph, the bubbles are plotted randomly along the horizontal axis.
But let’s instead plot them based on 2021 vaccination rate:
We can see that the countries with the most unexpected positive fertility trends actually had some of the most vaccines given during 2021.
Overall, there is a weak but noticeable correlation between more vaccines and more extra births. The yellow dotted line is the regression line.2
Correlation is not causation. The vaccination rate probably has no impact on births, and is just correlated with other things (income? High-trust?) that led to more births. Or the correlation may be purely random.
At any rate, this chart is not consistent with the idea of vaccines causing infertility on any kind of worrisome scale.
One could add a million control variables to the above analysis,3 but the trend holds when high-income countries are isolated.
It's very clear from that chart that Covid vaccines do not have any population-wide effect on fertility.
A case study in misleading statistics — don’t trust cats to do data analysis!
As mentioned, several commenters had alerted me to a post on a very popular Substack called “Bad Cattitude.”
The writer takes itself very seriously, calling itself “El Gato Malo”, and it seems that tens of thousands of people follow “The Bad Cat” for its willingness to post data that go against what the establishment says.
I’ll repeat its graph on Denmark (blue line is births, red is unvaccinated people):
It looks like births plummet as soon as people get vaccinated! 🙀 Worse, the cat reports that this pattern hold across numerous other countries, which it also graphed.
I suspect that the author is well-intentioned. The cat writes:
“honestly, i really hope this not what it looks like. the ramifications are just staggering and it honesty is making me a little sick to my stomach to work with this data.”
I hope my post will save the cat’s owner on steam-cleaning bills.
Let’s look at the problems with the Denmark graph. The two biggest are:
The scale is expressed in percentages, creating an optical illusion that births are plunging to near zero — one has to look closely at tiny font to notice that the cat’s own chart actually shows births falling by just 5% to 10%.
The vaccine data are scaled to map perfectly onto the fall in births, giving the illusion that they are nearly perfectly correlated.
Two other more minor issues in the footnote.4
Removing the optical illusions by graphing things in absolute terms, we get (as we saw above):
That’s much less scary.
I think it’s fascinating to look at the above two graphs, and remember that they are using the same underlying data — just making different graphing and scaling choices. Doing it in absolute terms to avoid illusions makes all the difference.
A reminder that there are clinical studies, too, which find no effect
This study looked at people who were trying to conceive, examining 897 unvaccinated people and 1,229 vaccinated people. They found that vaccinated people were no more or less likely to conceive. Now the big-picture data have confirmed such studies.
Why no effect?
Given that Covid vaccines definitely can cause disruption to menstrual cycles, some might still be skeptical.
Commenter Julia D. notes:
Any major stressor can cause your body to say "nope, let's not get pregnant right now" and trip up your cycle. Such stressors can include vaccination, infection, strenuous exercise … This is common and temporary.
A Medium article discusses further:
Dr. Male emphasized … "Vaccine hesitancy among young women is largely driven by false claims that covid-19 vaccines could harm their chances of future pregnancy."…
… [short-term] menstrual changes can occur after vaccination or infection, suggesting that immune reactions to a stimulus are the likely driver. Once the immune reactions subside, the menstrual changes should subside too.
Conclusions
— People should not be concerned about the impact of mRNA vaccines on fertility.
— It’s a moot point now about Covid vaccines, but mRNA vaccines will surely be used to fight more diseases in the future. People should be aware that we now have global data which shows that there is no broad impact on fertility.
— It’s good that people are digging into data, since the whole Covid episode showed that medical authorities often say what’s popular with their social in-group instead of what’s true. But people need to be careful to critically analyze graphing and statistical choices.
— Be suspicious of cats’ statistical analyses.
Want to see all of the beautiful country graphs? Here they are!
The regions are Hawaii and Northern Ireland. I don’t know why they are faster at reporting their birth data than are the US and UK as a whole — But I’ll take any observations I can get!
The r^2 is .07, meaning the vaccination rate predicts about 7% of the difference in excess births. Note: This only means there is weak correlation, not causation.
It’s interesting, just looking at the chart, that developing countries with low vaccine rates had fairly high birth declines (perhaps due to the relatively greater economic stress from Covid in poor countries.) But looking just at the cluster of developed countries, there is also a correlation between more vaccines and higher excess births.
The first two are the big problems causing misunderstanding in this situation, but these two graphing choices can also cause problems:
By the measuring the y-axis in change rather than in absolute terms, the graph would make a steady down- or upward- trend appear flat. A diversion from the trend would be visible (extra visible, in fact) but it would fail to convey the bigger picture.
The chart starts in 2019, thus not giving a great sense of the overall trend.


Random thought. Given that the internet is such a fertile playground for people with no expertise in statistical analysis, but people mistrust institutional expertise, I wonder how we might ascertain someone's fitness for the task. Does some kind of independently verified credential, recorded on the block chain, have a future solution role?
I found one other amusing thing about El Gato Malo. He's a writer at Brownstone:
https://brownstone.org/author/el-gato-malo/