Where is your vote worth the most?
Mapping the importance of different votes in the US presidential election
The US electoral college system means that votes are worth different amounts depending on which state one votes in.
The American founders designed the system to make sure each state was properly represented, and they succeeded. But an inevitable side effect is that individual votes within each state are not equal, because if most people in your state agree with you, then your opinion matters little.
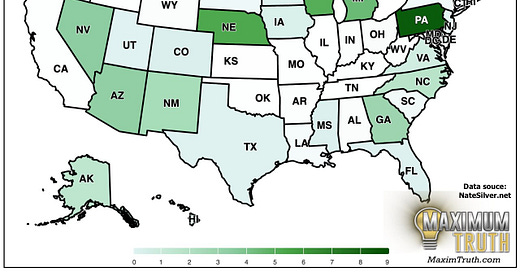
Value of a vote, by state
The big, obvious factor in determining the value of a vote — more specifically, the chance of a vote determining an election — is how close the election is in a state. But another big factor is the correlations between how different states tend to vote, as well as discreet number combinations.
For example, if Pennsylvania, Wisconsin, and Michigan all tend to vote the same way, then that can dramatically increase the importance of the single electoral vote in Nebraska’s 2nd Congressional district (Omaha), which would then control the balance of power.
Calculating that factor is not easy. I tried to do an estimate earlier this year, but didn’t get enough time. I’m a fan of Nate Silver’s approach, which is to run 40,000 election simulations, based on historical correlations and current polling data, and figure it out that way. I’m glad he’s done that work, but he hasn’t mapped it out, so I’ll do that here:

Here’s another way to visualize the value of a vote in each state (votes in states not listed are worth approximately 0):

As you can see, there are massive differences between states. Many of them you probably already knew about.
But I bet you didn’t know that a vote in Pennsylvania is worth 3 times more than a vote in Michigan or Georgia.
Or that a vote in Nebraska’s 2nd Congressional District (Omaha) is worth more than any vote outside of Pennsylvania or Wisconsin.
Using this info for campaigns, and individual decisions
These numbers could help election campaigns direct ad spending and campaign events.
They may also help us individuals make decisions. If you live in one of the green states (and especially Pennsylvania, Wisconsin, Michigan, or Nebraska CD-2) it’s probably worth voting, thinking hard about your vote, and picking the best of the two major-party candidates.
On the other hand, if you live in a state colored white on the above map, there’s little reason to care much about your Presidential vote (though there may still be important non-Presidential races.)
Analyzing candidate spending
Are the campaigns spending rationally, in line with the estimated value of a vote in each state? Roughly, yes. The WSJ made the following graph showing how much each campaign, and its allies, are spending in each state, per electoral vote (which is almost entirely proportional to individual votes):
In general, the campaign spending lines up very closely with Silver’s estimate of the value of a vote in each state.
Here’s another way to consider the same thing:
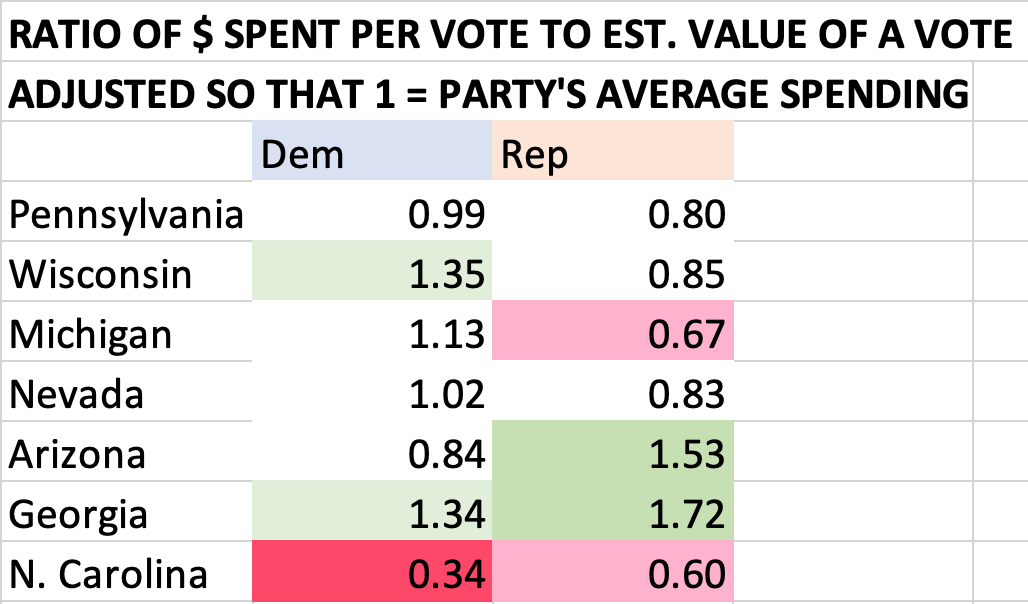
Now we can take the ratio of that amount spent per thousand votes, and Silver’s estimate of the value of each vote. I also normed the below numbers so that 1 = the average amount spent in a swing state by the party and its supporters:
This shows that, compared to Silver’s estimates, both parties are over-spending in Georgia, and under-spending in North Carolina.
It shows that, for example, Republicans are spending 72% more in Georgia, compared with their other spending, than Silver’s model would advise. It shows that Democrats are spending only a third as much in North Carolina as the model calls for.
Republicans appear to be under-spending in Michigan, and Democrats over-spending in Wisconsin.
Of course, one could also take the view that the political actors know better than the model where votes are most valuable.
It’s also possible that factors besides the value of votes are in play. For example, the media markets in Georgia could conceivably be cheaper per vote than in Pennsylvania, and that explains the difference. Relatedly, there could be diminishing marginal returns to spending, and Pennsylvania is already close to “maxed out” in terms of ad saturation.
Those are some reasons why spending could differ from the model, and still be rational.
In general, I’d say ad spending reflects the model pretty well — the rank order of spending is pretty similar.
Nebraska’s 2nd Congressional District is overlooked
Silver’s analysis now lists Nebraska’s 2nd Congressional District as having the second-most valuable votes in the country, after Pennsylvania. One extra electoral vote is particularly important this year, largely due to the following not-unlikely combination which leads to a 270 - 268 win for Harris:
In that scenario, if Trump were to win Nebraska CD-2, then it would be 269-269 — and Trump wins in a tie, because Republicans will have more state delegations in the House.
How much, in dollars, is your vote worth?
Let’s get a very rough sense of how much a vote is worth.
First, let’s consider a “revealed preference” estimate, looking at campaign spending. The WSJ reports that Republicans and Democrats have spent a combined $42 million on the Presidential election in Pennsylvania in just 3 weeks (July 22 - August 12) or $6 per voter. That’s going to be a tiny fraction of the total spent there; if past trends are any guide, the total amount would be at least 10x higher in the time until the election. So that’s $60 per voter.
Most voters are locked in, so a marginal vote is probably worth still much more than that to campaigns.
That represents the value to the campaigns. But if there’s a real difference between the candidates, then the value of the election is higher to the country, than to the campaigns themselves. For example, let’s say that the better candidate will make GDP 1/10th of 1% higher. That’s $25 billion. Over the 57 million voters in all the above swing states, that’d lead to an average value of something like ~$500/vote, just on economic issues.
Those are very ballpark numbers, but it suggests that, if one has any confidence at all that one candidate is better than the other, and you live in certain states, and you are a more informed voter than average, then your vote is quite valuable to society
A similar logic probably applies to the House and Senate — many states have competitive races this year, and overall control will be close.


Just as a minor note, your vote also has very little value if the great majority in your state disagree with you. When I lived in California I could be sure its electoral votes were going Democratic; my voting Republican had no chance of changing the outcome.
This is great! Is there a way to estimate probability that a vote is pivotal by state from the relative voter power index? Nate co-authored this paper that estimated the likelihood that given vote would flip the election by state, and found that some states had a > 1 in 10 million chance. http://www.stat.columbia.edu/~gelman/research/published/probdecisive2.pdf
Under your $25 billion value of winning assumption, that places the value of a vote at $2500 in those states. I think that is still probably an underestimate in swing states, as I think the difference in outcomes is probably worth more than that most of the time.