Can polling bias help predict the election?
Answer: Not so much. But maybe watch out for Wisconsin
While the betting odds are the best single way to predict of what will happen in the election, I’m fascinated enough by politics that I also dig into the polling.
From following it for years, I’m well aware that there are persistent polling biases in certain states. But which states? How much? For which party?
So, I graphed it out. The yellow bars below show the current polling average in each state, where above zero means Trump leads, and below zero means Harris leads.
The blue bars show what happens if you adjust the current polling average based on polling errors (the difference between the RealClearPolitics polling average, and the actual voting results) from previous years:
My adjustment is very simple: if previous polls underestimated Trump’s margin by 4 points, then it simply adds 4 points to his 2024 estimated margin. The different blue bars all show different versions of the adjustment: dark blue adjusts for the error in 2020, light blue for 2016, and regular blue for the average error in both years Trump ran.
Past polling error hints that Trump is in slightly better shape than the raw RealClearPolitics average shows (which also shows him with razor-thin lead.)
In particular:
Main takeaway: Democrats should be more worried about Wisconsin
IF the polling bias of the last two Trump runs says anything about polling bias this cycle, then Harris is in trouble in Wisconsin, contrary to what the betting and Nate Silver’s model suggest (they both have it leaning slightly for Harris.) Note that Silver’s statistical model does not consider polling bias in the way I am here.
In both 2016 and 2020, the polling average overstated Trump’s opponent’s margin by more than 5 points. Biden still barely won Wisconsin in 2020, but the polling average has predicted Biden would win it easily.
Nevada, Arizona, and Georgia polls have not shown bias when it comes to polling Trump
We can take those polling averages pretty much at face value.
Pennsylvania and North Carolina sometimes slightly underestimate Trump
However, the bias was less in 2020 than in 2016, and in Pennsylvania the bias was effectively zero in 2020. Trump should be at most slightly encouraged by previous polling bias in these states.
Historically, would it have helped to account for polling bias like this?
Implicit in my ultra-simple “model” here is that Trump is a unique phenomenon. I assume that polling for Mitt Romney in 2012 is irrelevant in the era of Trump. I also assume midterm polling bias is irrelevant. Trump brings out a unique kind of low-turnout voter, and furthermore is so controversial that it could cause some voters to not tell pollsters about their true voting intention.
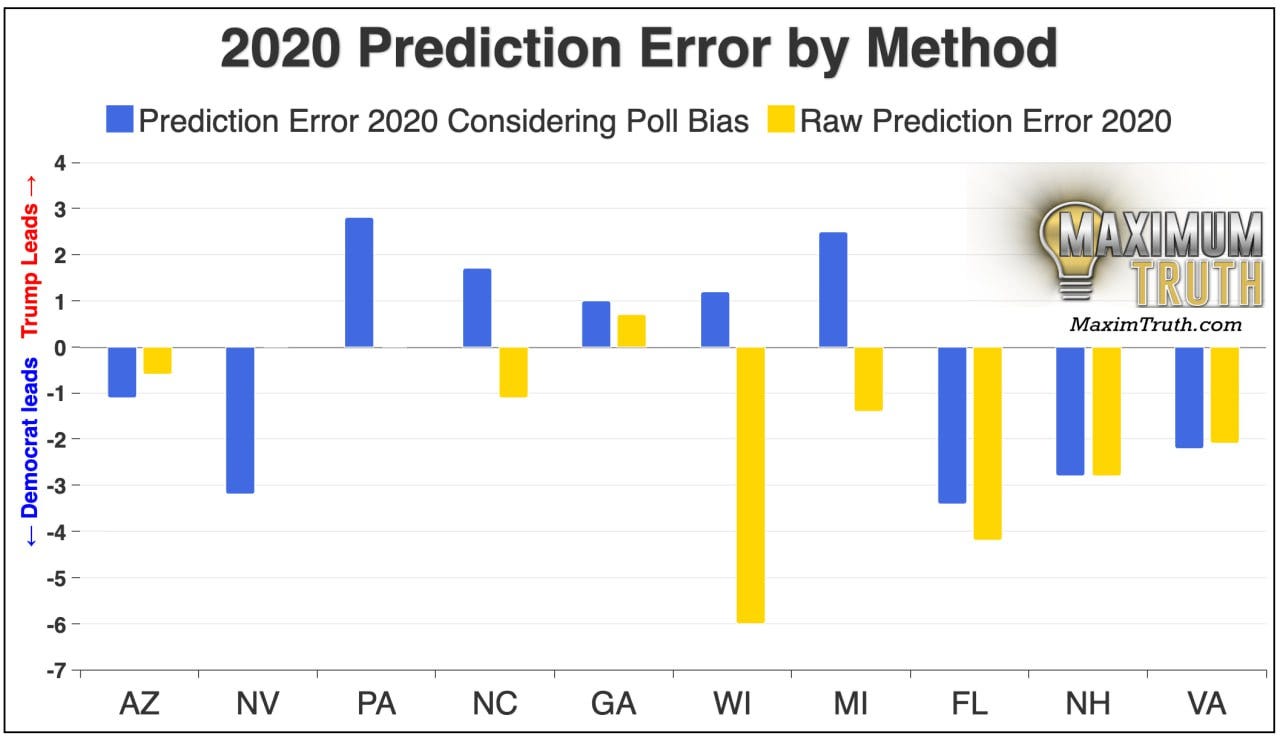
But considering just Trump-specific races, we do still have one election to back-test my method on. I wanted to know: Would adjusting the 2020 polling for 2016 bias have helped predict the 2020 outcome? Would it have been better than just using the raw 2020 polling average?
Here’s a chart on that:
The graphic shows that adjusting 2020 polls for 2016 bias actually increases absolute prediction error slightly while at the same time significantly reducing bias.
In other words, the blue bars have greater total area than the yellow bars — the polling-bias-adjusted estimate was less precise at predicting the outcome. BUT, the blue bars are relatively unbiased, by which I mean they are centered around zero, unlike the yellow bars, which almost all erred in Biden’s favor.
Specifically, the unadjusted polling average underestimated Trump’s margins by 1.75 points. Adjusting the 2020 polls for 2016 bias led to predictions that only underestimated Trump’s 2020 support by 0.35 points. That means that the overall polling bias was about equally bad in 2016 and 2020.
However, the absolute error for the unadjusted polls compared to the actual election results, was 1.9 points. Adjusting the polls for 2016 acutally increased the average state’s error slightly, to 2.1 points.
We can see where that comes from by looking into the details: basically, 2020 polls in Nevada and Pennsylvania were spot on. Assuming they’d retain their 2016 bias would actually have make one’s predictions worse.
On the other hand, Wisconsin’s 2020 polls were way off, by 6 points, and adjusting for 2016 woud’ve made one’s prediction much closer.
For 2020, the best principled adjustment strategy would actually have been to not adjust polls by state, and instead just give Trump an extra 1.4 points in every state (that was the average 2016 bias.) That yields an average absolute error of 1.55 points.
While that’s what would have worked best to predict 2020, it’s a small sample size, and personally I can’t shake the sense from these graphs that something unique is wrong with Trump polling in Wisconsin.
Conclusion
Previous polling bias doesn’t seem to have much predictive power, but Wisconsin is such an outlier that I wonder if bettors and modelers are underestimating Trump’s chances there.
Pollsters in Wisconsin have now badly botched two Trump elections in a row. Will that hold for a 3rd year? It’s possible that the pollsters there have learned their lesson, and are now weighting Trump demographics more heavily. In that case, the poll error adjustment could mislead.
It’s also possible that it’s now more socially acceptable to support Trump, and that the “shy voter” effect is going away. As Silver notes:
declaring one’s support for Trump has become more socially acceptable among certain subgroups, like Silicon Valley or crypto types or younger voters of color.
That could also be a reason not adjust based on previous polling error.
But overall, if I were a Democrat, past polling bias would make me worry more about Wisconsin.


Interesting analysis. Looking forward to seeing what goes down in Wisconsin!
why do you think this apparent and persistent bias is not priced in into betting markets?